Google Q1 2026 Earnings: Search +19%, US Revenue +23%
Alphabet posted Q1 2026 results on April 29, 2026: $109.9B total revenue (+22% YoY), Google Search & Other ads at $60.4B (+19%), YouTube ads at $9.88B (+11%), and Google Network down 4%. For US advertisers, the important read is not a direct CPC disclosure. Alphabet does not report Google Ads CPC. The signal is that US revenue rose 23% and Search revenue rose 19%, with retail and financial services leading growth. If your clicks did not rise with spend, that growth is likely showing up as CPC pressure in your account.
The numbers
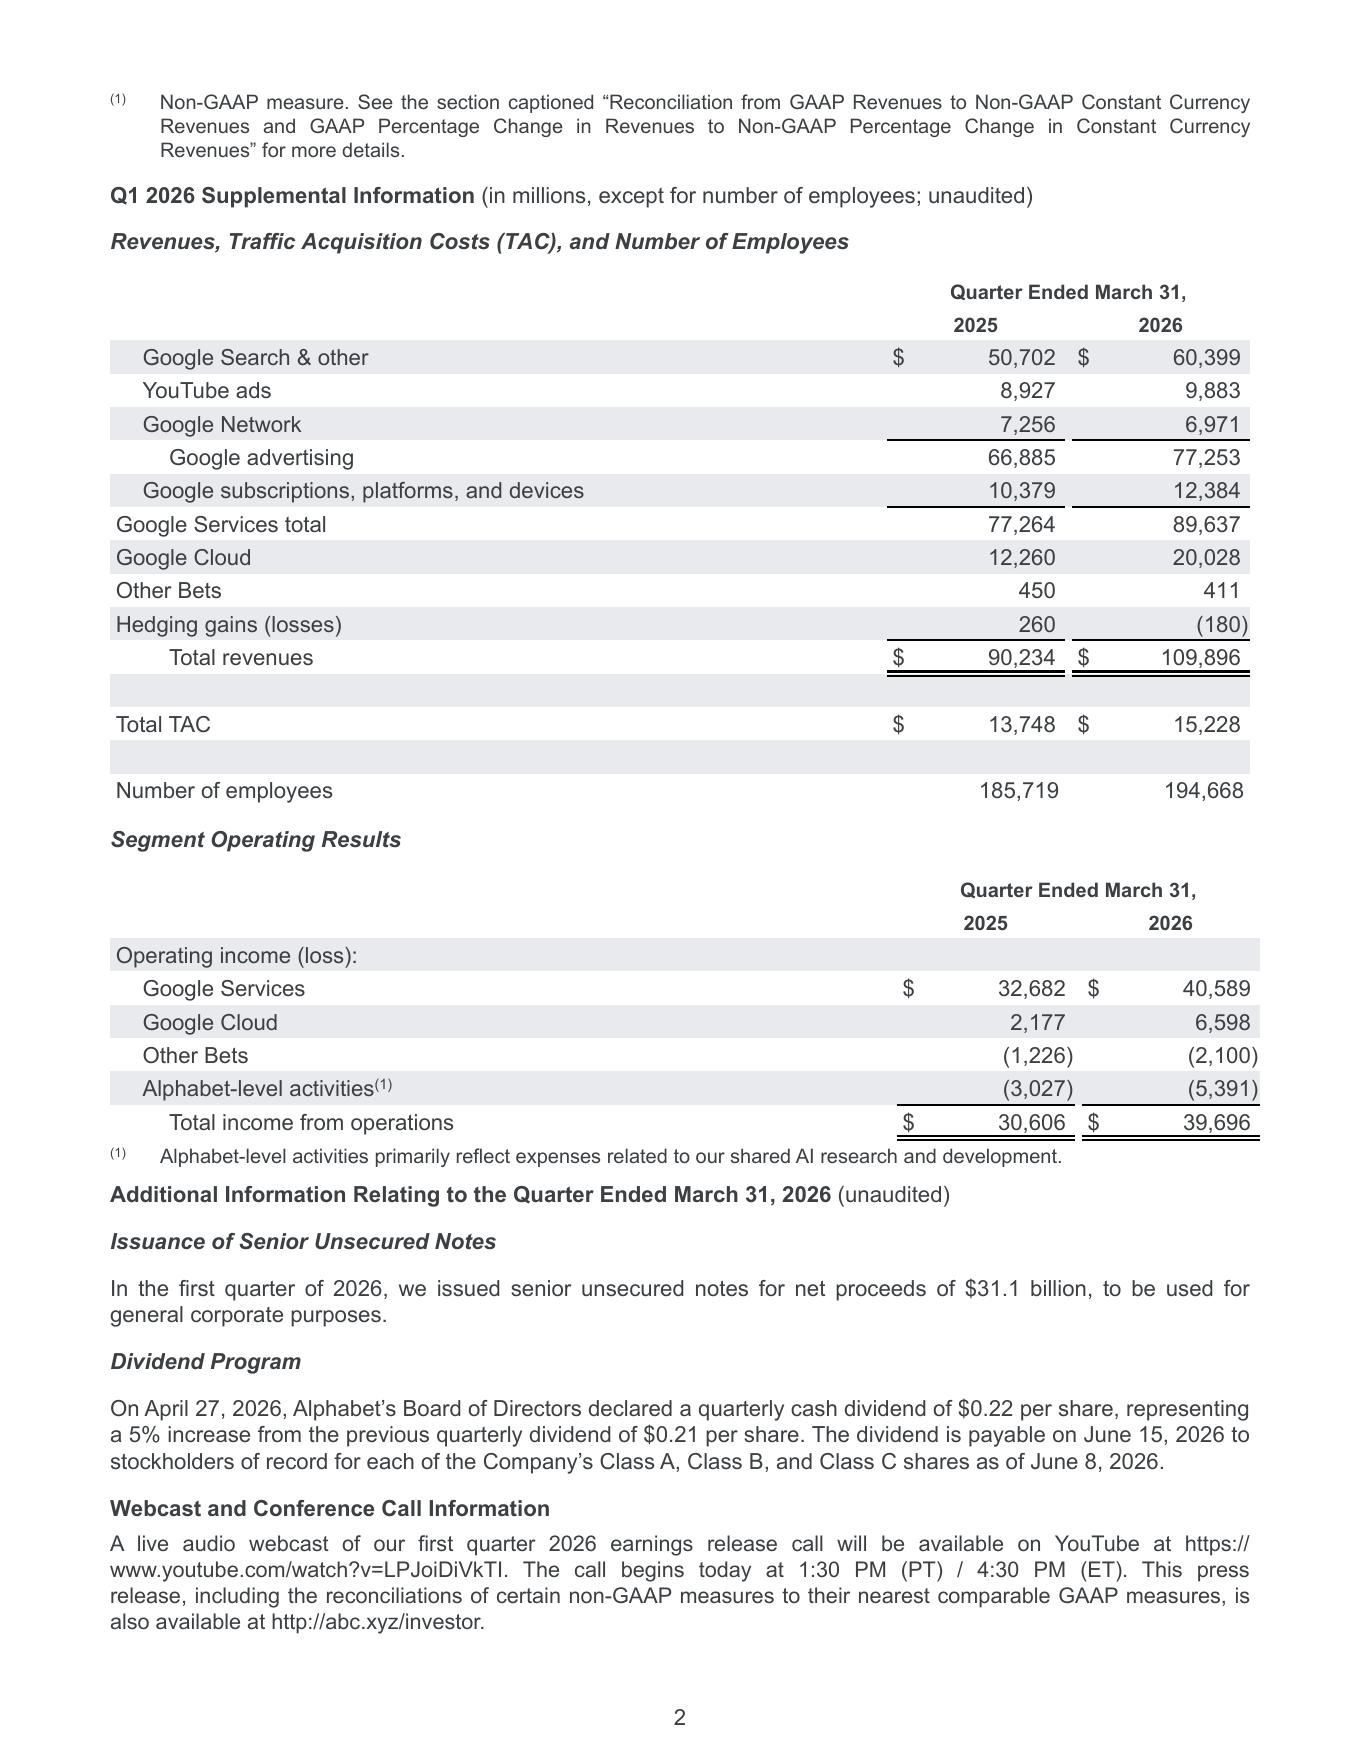
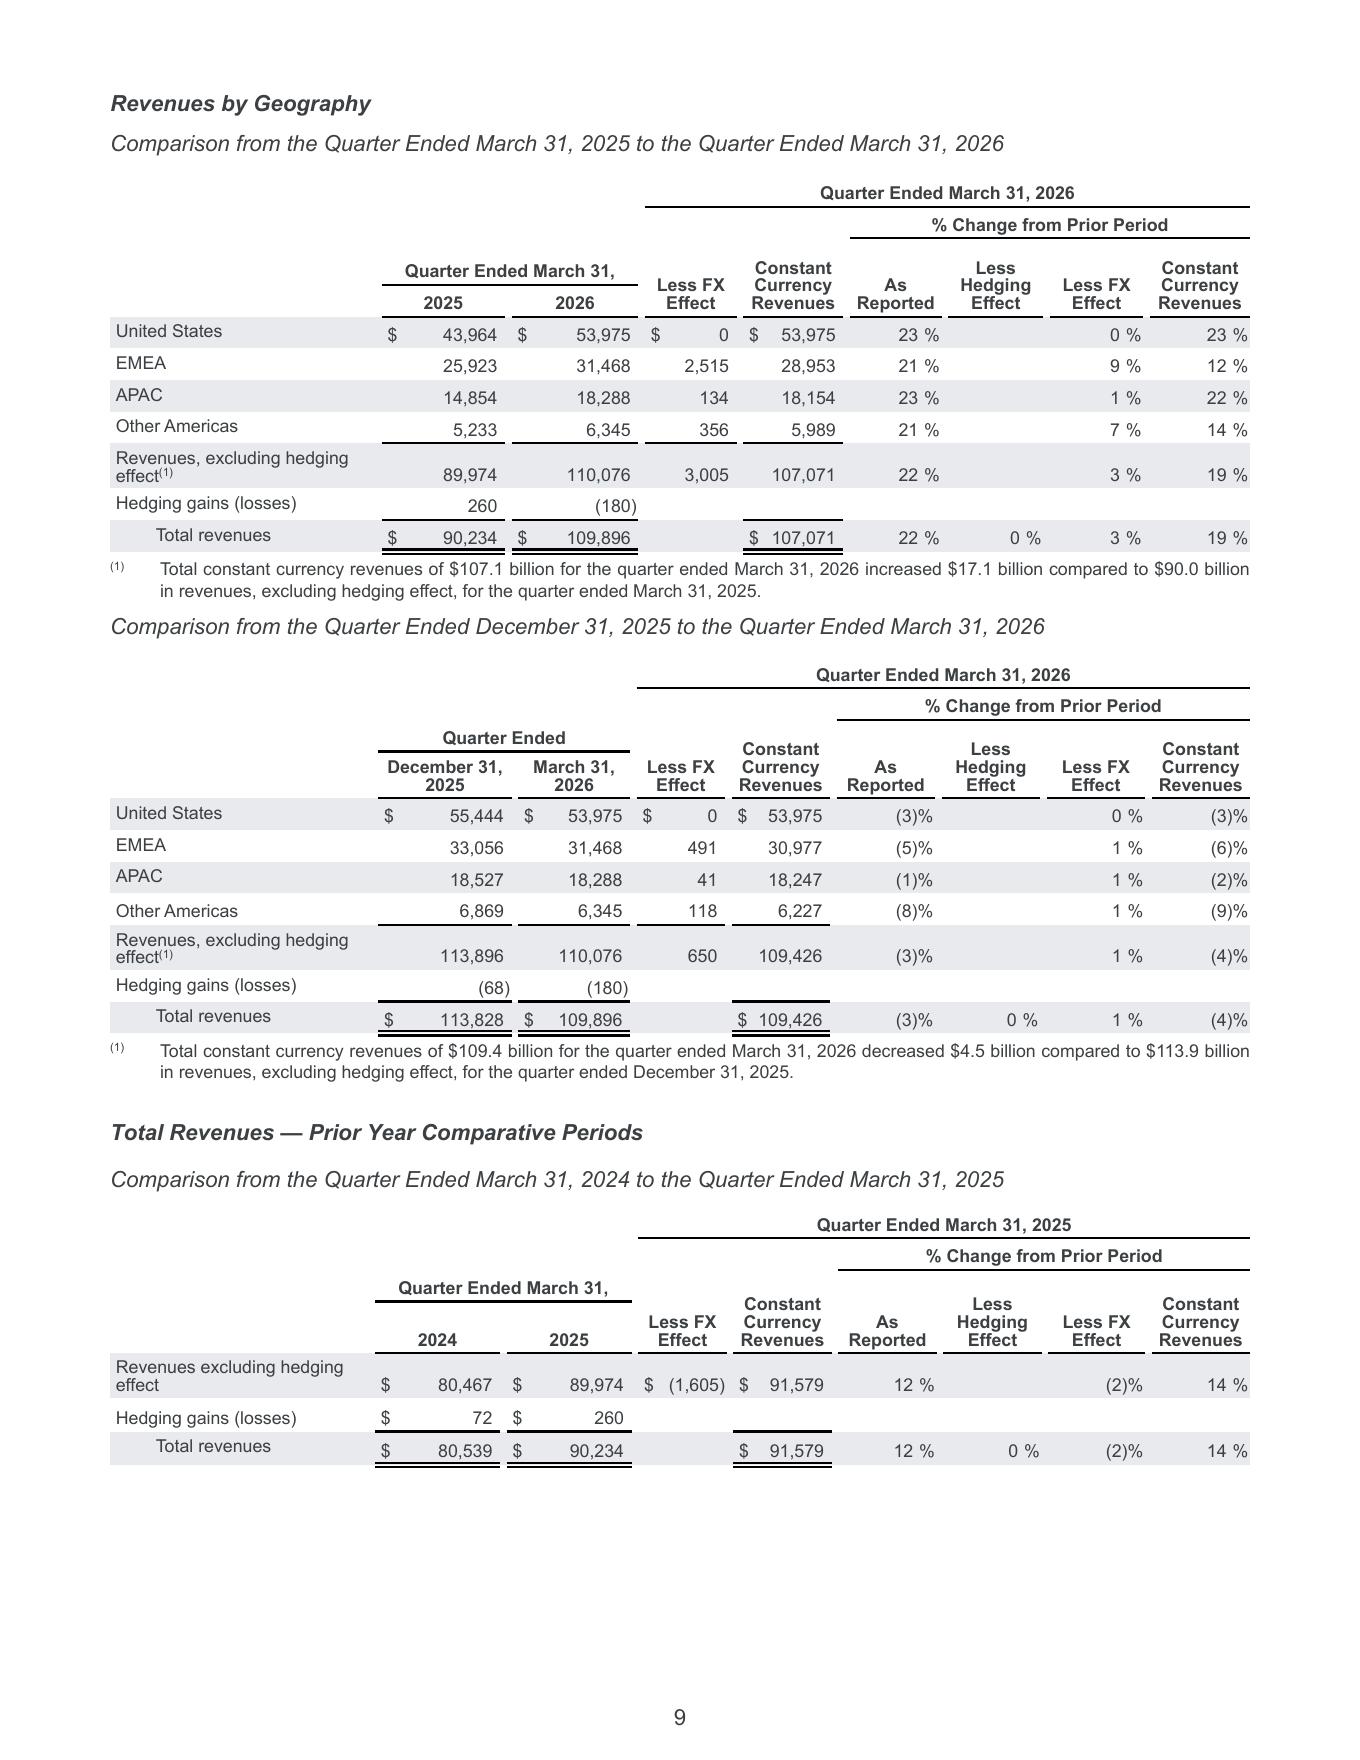
- Total revenue: $109.9B (+22% YoY, +19% constant currency)
- United States revenue: $54.0B (+23% YoY)
- Google Search & Other ads: $60.4B (+19% YoY), led by retail and financial services
- YouTube advertising: $9.88B (+11%), driven by direct response and brand
- Google Network revenue: $6.97B (-4% YoY)
- Total Google advertising: $77.3B (+15% YoY)
- Google Cloud revenue: $20.0B (+63% YoY); backlog reached $462B
- Operating income: $39.7B; operating margin 36.1%
- Net income: $62.6B, helped by $36.9B in net equity-security gains
- Q1 capex: $35.7B; 2026 capex guidance raised to $180B-$190B on the call
The US CPC read
Unlike Meta, Alphabet does not publish an "average price per ad" metric by geography. That means you should not read the earnings release as a clean CPC benchmark. The official signal is broader: Alphabet's US revenue increased 23% YoY, Search & Other ads increased 19%, and management called out retail and financial services as major contributors to Search growth.
For account planning, the practical question is whether your click volume kept pace with spend. If your US Google Ads spend rose 20% but clicks only rose 5%, then CPC inflation is doing most of the work. If clicks rose at the same pace as spend, the pressure is more about total demand and budget scale than cost per click.
Search revenue up 19% and US revenue up 23% tell you the auction is still expanding. Your account-level CPC, CTR, impression share, and search lost IS by budget tell you whether that expansion is healthy volume or expensive incremental clicks.
What advertisers should actually take away
AI Max / Performance Max is now mainstream, not experimental
On the earnings call, management said more than 30% of Search customers now use AI-enabled campaigns such as AI Max or Performance Max. That is not "majority" adoption yet, but it is enough to treat AI Max as a mainstream test surface. The right move is not to abandon exact and phrase match; it is to run controlled tests where conversion tracking, negative keywords, brand exclusions, and value rules are already clean.
AI Overviews and AI Mode drove "all-time high" query volume
The fear was that AI summaries would cannibalize Search ads. Q1 did not show that. Search ads grew 19% YoY, and Google's CEO remarks said AI Overviews and AI Mode are contributing to overall query growth. For advertisers, this means search supply is still expanding; the SERP is just changing shape. Audit your top 50 non-brand keywords in incognito and in Ads Preview to see where AI answers, Shopping units, and text ads now render.
YouTube ads at +11% is a slowdown — direct response narrowing
YouTube ads grew 11% to $9.88B, driven by direct response and brand. That is still growth, but it is slower than Search and much slower than Cloud. For DR advertisers using YouTube, the operator question is whether Shorts and Demand Gen are improving incremental conversions or just absorbing budget. Tighten your conversion-action setup, separate view-through from click-through reads, and watch Shorts inventory specifically.
Google Network -4% — the structural decline continues
Network revenue, which includes Google partner inventory, was down 4% YoY. Brands relying on Display Network for cheap reach should expect ongoing volatility and less clean control over where incremental spend goes. Before you move budget into Performance Max, split branded, shopping, display, and YouTube contribution as cleanly as possible; otherwise PMax can make a shrinking Network problem look like a blended-account win.
Retail and financial services are leading verticals
Management called out retail and financial services as strong contributors to Search growth. If you're in those verticals, expect continued auction pressure from more competition, broader match behavior, and higher-value queries. If you're outside those verticals, do not blindly apply the +19% Search growth line to your own budgets. Pull Auction Insights, CPC, impression share, and search lost IS by budget for your category before you reset targets.
What to check in your account this week
- 1 Pull Q1 2025 vs Q1 2026 spend, clicks, CPC, CTR, CVR, and impression share. Search revenue growth does not tell you whether your account is buying more clicks or paying more for the same clicks.
- 2 Separate US from blended global performance. Alphabet reported US revenue +23%, but that is total company revenue. Your Google Ads read needs US-only campaigns, US-only queries, and US-only conversion value.
- 3 SERP audit on your top 50 non-brand keywords. Use incognito and Ads Preview. Document AI Overviews, Shopping units, local packs, and ad position before you blame CPC alone.
- 4 Run an AI Max pilot only where tracking is clean. Pick a non-flagship campaign, hold back a manual-control cohort, and judge the test on marginal conversion value, not just reported conversions.
- 5 Pull Display Network and PMax placement contribution. Network revenue is shrinking; make sure PMax is not hiding low-quality display or YouTube expansion inside a blended ROAS number.
Sources
- Alphabet Q1 2026 earnings release PDF
- Google blog - Alphabet Q1 2026 CEO remarks
- The Motley Fool - Alphabet Q1 2026 earnings call transcript
- Alphabet Investor Relations
Catch Google Ads incidents in 5 minutes, not after a client email
Google is shipping more AI-driven campaign automation in 2026. When something breaks, you want to know first. AdStatus monitors Google Ads alongside Meta, Microsoft, Pinterest, Amazon, Shopify, ChatGPT, and Claude. $10/month.