The Great Advertising Platform Showdown 2024-2025
Who's Winning the Digital Ad Wars? Complete Analysis of Meta, Google, Microsoft, Snapchat, and Pinterest
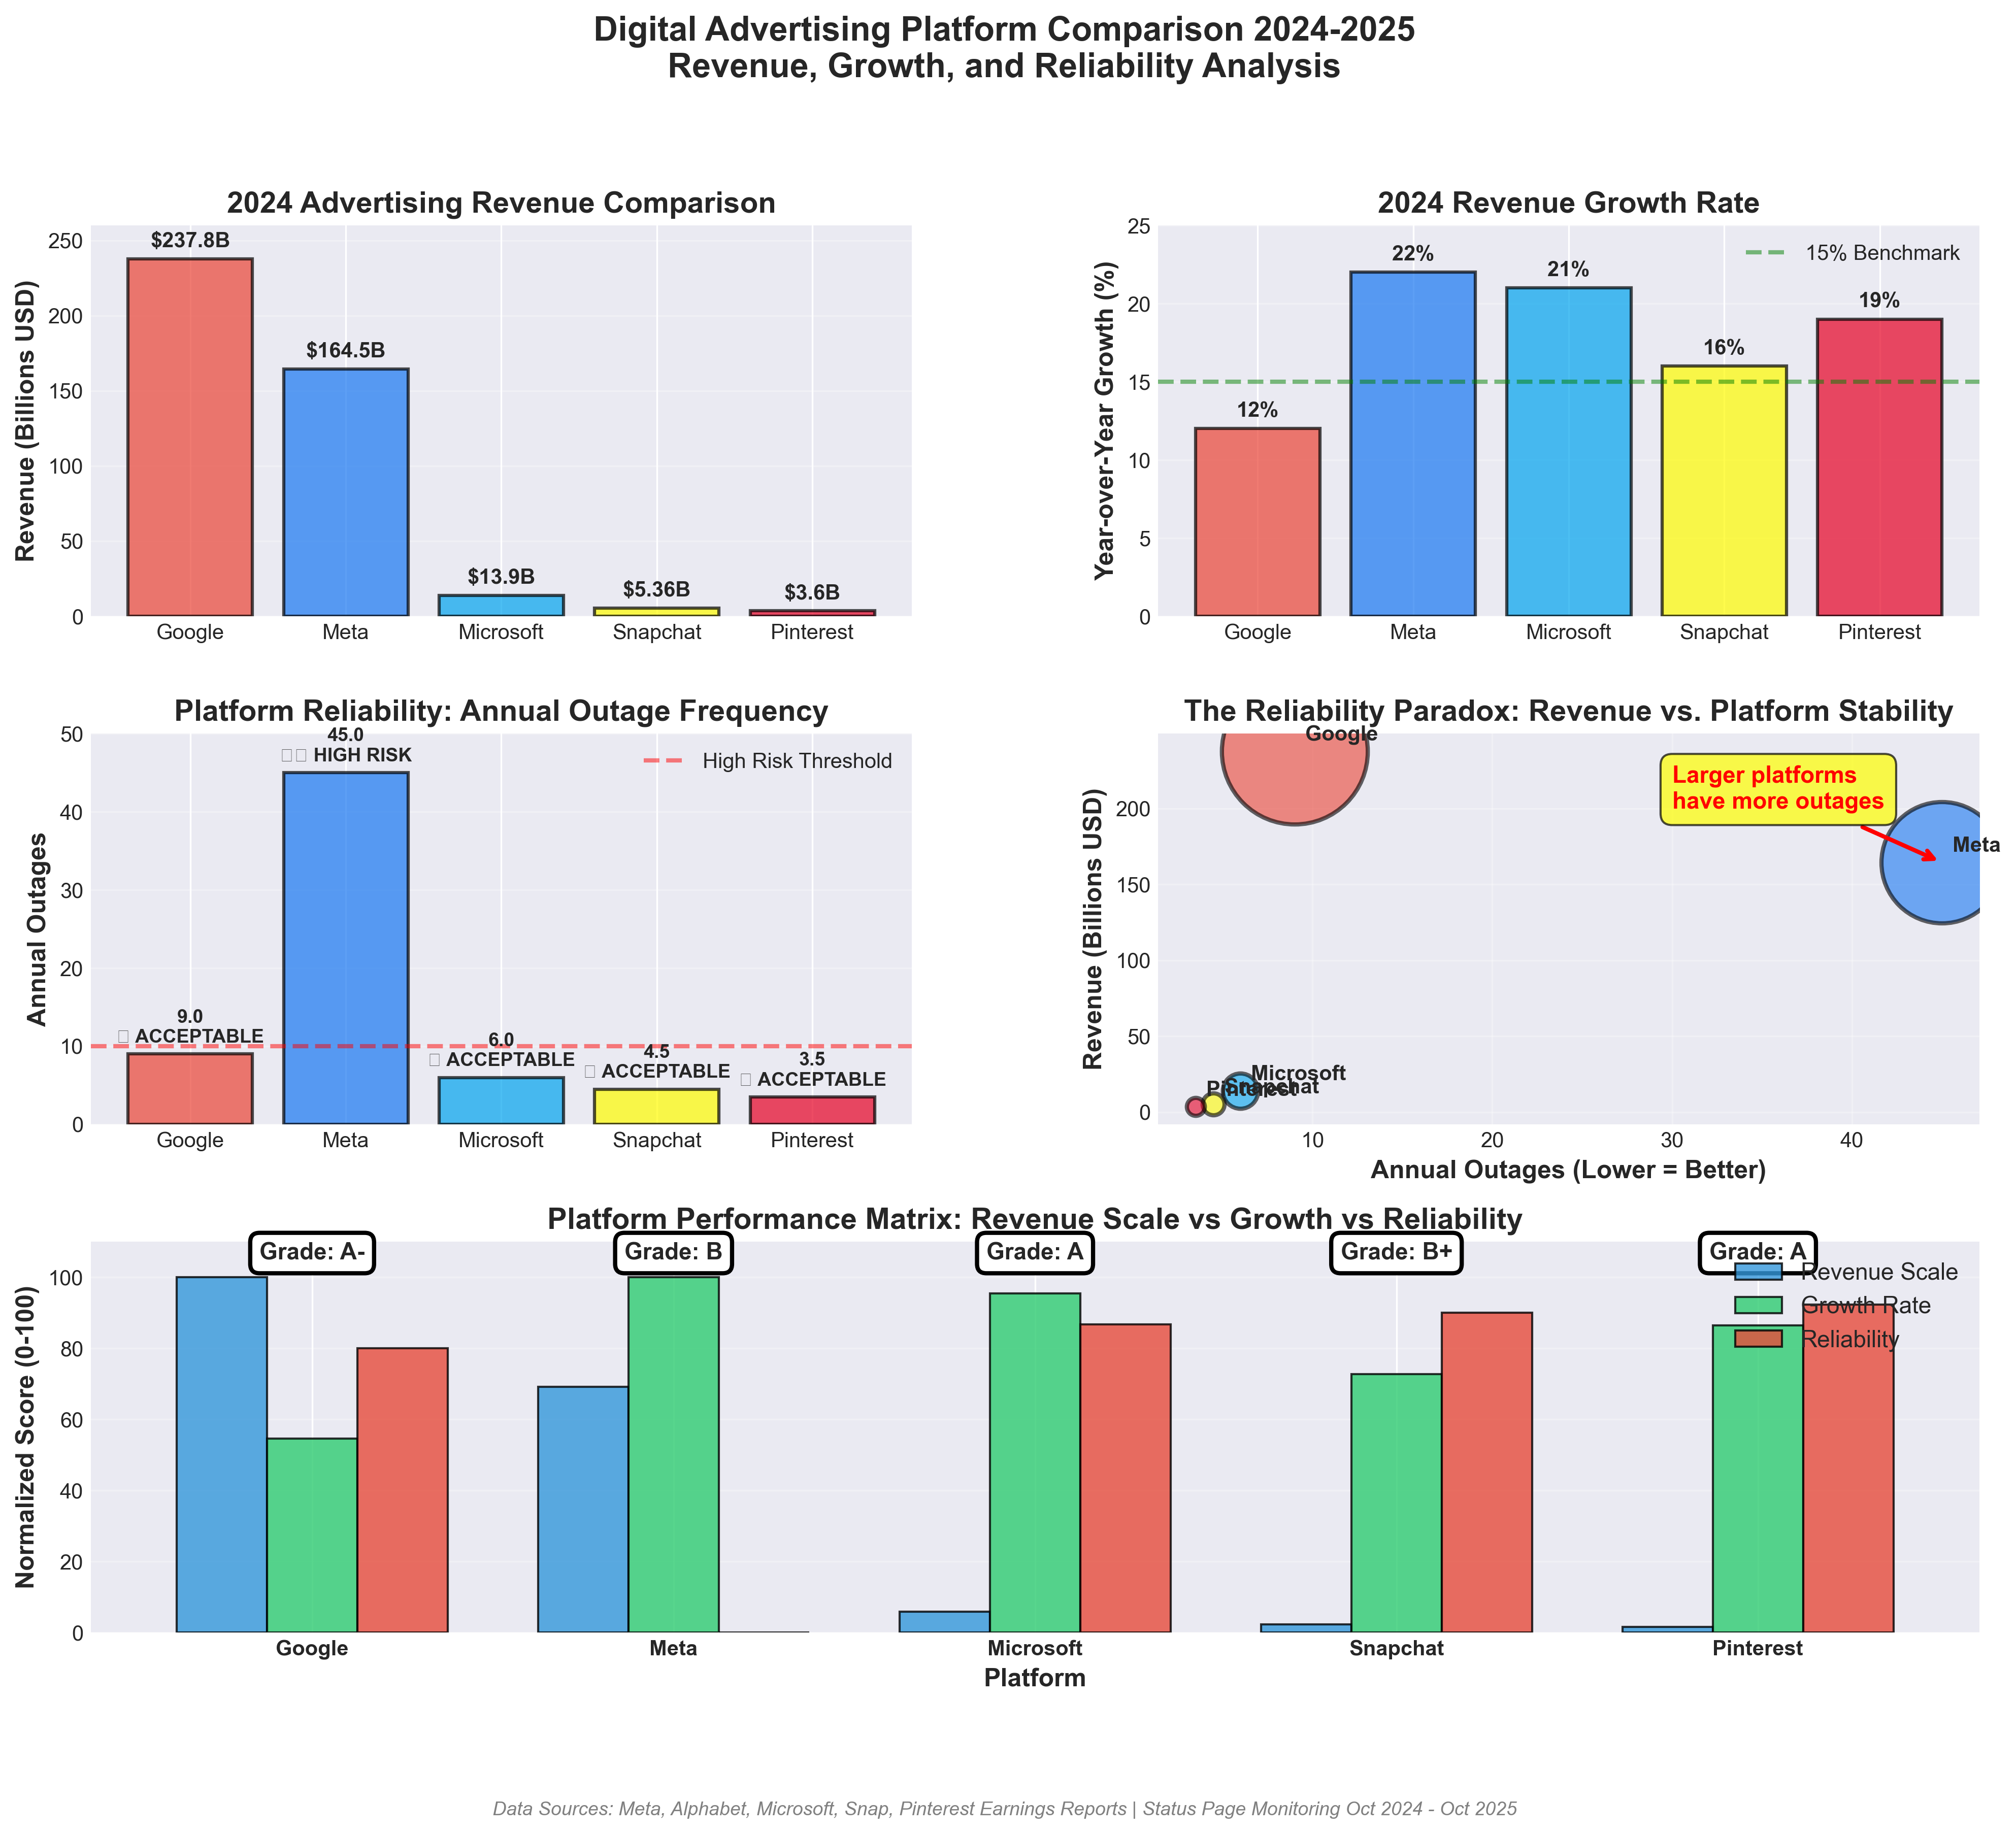
Comprehensive platform comparison showing revenue, growth rates, reliability scores, and overall performance grades
Executive Summary
Key Finding: The digital advertising landscape is experiencing unprecedented growth, with smaller platforms showing exceptional revenue momentum while established giants maintain market dominance.
Platform Rankings at a Glance
| Platform | 2024 Revenue | YoY Growth | Market Position | Grade |
|---|---|---|---|---|
| Google Ads | $237.8B | 12% | Market Leader | A |
| Meta | $164.5B | 22% | Fastest Growth | A- |
| Microsoft | $13.9B | 21% | Rising Star | A |
| Snapchat | $5.36B | 16% | Youth Leader | B+ |
| $3.6B | 19% | ROI Champion | A |
Meta (Facebook/Instagram Ads)
The Social Giant: AI-Powered Growth Leader
2024-2025 Performance
The Revenue Story
Meta delivered a stunning $164.5 billion in revenue for 2024, representing a 22% increase from 2023's $134 billion. This growth significantly outpaced Google's 12% and positioned Meta as the fastest-growing major advertising platform.
AI-Powered Advantage
Meta's investment in AI is paying dividends:
- 4+ million advertisers using generative AI ad creative tools
- Advantage+ shopping campaigns surpassed $20B annual run-rate
- 70% YoY growth in Advantage+ usage
Best For
- E-commerce brands with strong visual products
- B2C companies targeting broad consumer audiences
- Social commerce and community-driven brands
- Advertisers who can leverage AI creative tools
Expert Verdict
Innovation Grade: A+
Revenue Growth Grade: A+
Recommendation: Essential for B2C and e-commerce brands. Leverage AI tools for maximum performance. Ideal for visual products and social engagement.
Google Ads
The Reliable Workhorse: Market Dominance Through Stability
Market Leadership
Google Ads generated $237.8 billion in 2024, maintaining its position as the world's largest advertising platform. With consistent 12% YoY growth, Google's scale and comprehensive ad network make it the foundation of most digital advertising strategies.
Performance Metrics
- Average ROAS: $2 per $1 spent
- Average conversion rate: 6.96%
- Search market share: 91% globally
2025 Performance (Q3)
- Total Ad Revenue: $74.18B (up from $65.85B YoY)
- Search & Other: $56.57B (14% increase)
- YouTube Ads: $10.26B (15% increase)
Platform Advantages
- Unmatched search intent targeting
- Superior reliability with formal SLA agreements
- Comprehensive network (Search, Display, YouTube, Shopping)
- Transparent reporting and attribution
- Integration with Google Analytics
Best For
- Lead generation businesses (B2B and B2C)
- Local service businesses
- E-commerce with Shopping campaigns
- Advertisers requiring guaranteed uptime
- Companies needing detailed attribution
Expert Verdict
Market Position Grade: A+
Revenue Growth Grade: B+
Recommendation: Should form the foundation (35-45%) of most digital advertising strategies. Essential for intent-based marketing and comprehensive reach.
Microsoft Advertising
The Underdog Delivering: Consistent Excellence
Why Microsoft Is Winning
Microsoft Advertising achieved $13.9 billion in revenue for fiscal 2025, posting an impressive 21% YoY growth-matching Meta's growth rate despite operating at 1/10th the scale.
AI Integration Leadership
- Copilot integrated into Microsoft Ad Platform for natural language campaign creation
- Improved ad relevance through AI-powered targeting
- Better measurement tools for ROI optimization
Audience Quality
- Higher-income users (Bing skews toward professional/enterprise)
- Less saturated market = lower CPCs
- LinkedIn integration for B2B targeting
- Edge browser growth increasing reach
Best For
- B2B advertisers seeking professional audiences
- Businesses wanting lower competition/costs
- Enterprise targeting via LinkedIn integration
- Advertisers seeking Google Ads alternative
Expert Verdict
Innovation Grade: A+
Revenue Growth Grade: A
Recommendation: Most underrated platform. Allocate 10-15% for cost efficiency and B2B targeting.
Snapchat Ads
The Youth Marketing Powerhouse
Performance Highlights
Snapchat achieved $5.36 billion in revenue for 2024, representing 16% YoY growth, driven primarily by direct response advertising improvements.
- Active advertisers more than doubled in Q4 2024
- SMB advertising in North America growing 25%+
- Snapchat Plus subscription revenue exceeds $750M annual run rate
Unique Value Proposition
- Dominant among Gen Z and Millennials
- High engagement (30+ minutes daily average)
- Advanced AR advertising capabilities
- Perplexity AI integration ($400M deal)
Best For
- Brands targeting Gen Z and younger Millennials (under 35)
- Fashion, beauty, entertainment, and lifestyle brands
- AR-enhanced product experiences
- Mobile-first campaigns
Emerging Challenges
- Q4 2025 outlook shows potential user decline
- Platform-level age verification impacts
- New minimum age regulations affecting reach
Expert Verdict
Audience Quality Grade: A
Revenue Growth Grade: B+
Recommendation: Essential for youth-focused brands. Allocate 15-20% if targeting under-35 demographic.
Pinterest Ads
The Hidden ROI Champion: Quality Over Quantity
The ROI Winner
Pinterest delivers the highest return on ad spend among all major platforms with 32% higher ROAS than other digital platforms (Nielsen analysis).
Performance Excellence
- Pinterest achieved $3.6 billion in revenue for 2024 (19% YoY growth)
- Q4 2024: First time exceeding $1B in single quarter
- 537M+ monthly active users (11% quarterly growth)
- 30% lower cost per acquisition YoY during holiday shopping
- 80% trend prediction success rate (5 consecutive years)
Why Pinterest Outperforms
- Purchase Intent: 83% of users make purchases based on Pinterest content
- Planning Mindset: Users actively shopping, not passively scrolling
- Visual Discovery: Platform built for product discovery and inspiration
- Audience Quality: Higher household income demographics with purchasing power
Best For
- E-commerce brands (home, fashion, food, beauty)
- Businesses with strong visual products
- Wedding, home improvement, and lifestyle brands
- Advertisers seeking highest ROAS
- Long-term brand building
Expert Verdict
ROI Grade: A+
Revenue Growth Grade: A-
Recommendation: The hidden gem. Allocate 15-25% for e-commerce campaigns. Best ROI among all platforms.
Strategic Budget Allocation Framework
For Most Advertisers (Balanced Approach)
- Google Ads: 35-40% (foundation for intent-based conversions)
- Meta: 25-30% (reach and social engagement)
- Pinterest OR Snapchat: 15-20% (demographic-specific or ROI focus)
- Microsoft: 10-15% (B2B or cost efficiency)
For E-commerce Brands
- Google Shopping: 30%
- Pinterest: 25% (highest ROAS)
- Meta: 25% (Instagram shopping)
- Microsoft: 10%
- Snapchat: 10% (if targeting under-35)
For B2B Companies
- Google Search: 40%
- Microsoft/LinkedIn: 30%
- Meta: 20%
- YouTube: 10%
2025 Strategic Action Plan
Immediate Actions (This Quarter)
- Audit Current Allocation - Calculate platform dependency percentage and identify risks
- Diversify Risk - Cap Meta allocation at 50%, add 2+ additional platforms
- Implement Monitoring - Set up real-time campaign alerts and status updates
Medium-Term Strategy (2-3 Quarters)
- Optimize by Platform Strength - Align each platform with its core competency
- Build Platform Expertise - Train teams on multiple platforms
- Leverage AI Tools - Test Meta Advantage+, Google Performance Max, Microsoft Copilot
Long-Term Evolution (12+ Months)
- Reduce Platform Dependency - Invest in owned channels (email, SMS)
- Stay Agile - Monitor reliability trends quarterly and adjust budgets
The Golden Rules of Platform Selection
- Never allocate more than 50% to a single platform (diversification insurance)
- Reliability matters more than reach for time-sensitive campaigns
- Test smaller platforms (Pinterest, Microsoft) for efficiency gains
- Monitor, don't set and forget (monthly reviews minimum)
- Build backup infrastructure (assume outages will happen)
The Verdict: No Single Winner
Google Ads
Balance of scale, reliability, and performance. Foundation for most advertising strategies.
AMeta
Despite reliability issues, revenue growth is undeniable. AI tools driving adoption.
BBest uptime, highest ROAS, consistent performance. Limited by smaller scale.
AMicrosoft
Exceptional growth, low costs, high reliability. Underutilized by most advertisers.
ALooking Forward: The 2025 Landscape
The digital advertising landscape is at an inflection point. Meta's reliability crisis, Google's maturation, and the rise of alternative platforms signal a shift from "platform concentration" to "strategic diversification."
Winning Advertisers in 2025 Will:
- Spread risk across multiple platforms
- Prioritize reliability alongside reach
- Leverage AI tools where proven effective
- Maintain agility to shift budgets quickly
- Build owned channel alternatives
The $500+ billion digital advertising market is no longer a two-platform game. Smart advertisers will embrace the full ecosystem, reducing risk while maximizing returns.
Methodology & Data Sources
This analysis synthesizes:
- Official earnings reports (Meta, Alphabet, Microsoft, Snap, Pinterest)
- Public platform status pages (metastatus.com, Google Status Dashboard)
- Industry research (Nielsen, eMarketer, Statista)
- Advertiser performance data
- Platform reliability monitoring (Oct 2024 - Oct 2025)
Analysis Period: October 2024 - November 2025
Last Updated: November 12, 2025
Multi-Platform Ad Status Monitoring Guide
Compare reliability across all major advertising platforms and learn best practices for unified monitoring.
Read the Full GuideNever Miss an Ad Platform Outage Again
Get instant Slack notifications when Meta, Google, or Microsoft advertising platforms go down.
Start Free Trial